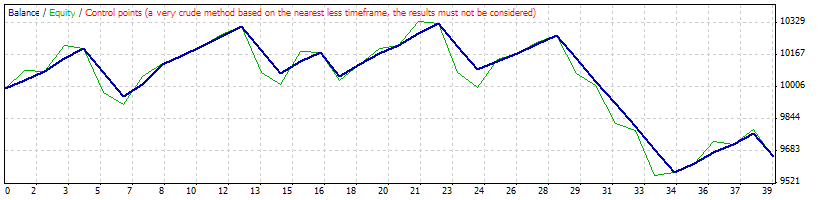
Strategy Tester Report
AlpariUK-Demo (Build 225)
| Symbol | USDCHF (US Dollar vs Swiss Franc) | ||||
| Period | 1 Hour (H1) 2009.12.01 00:00 - 2009.12.31 18:00 (2009.12.01 - 2010.01.01) | ||||
| Model | Control points (a very crude method, the results must not be considered) | ||||
| Parameters | TakeProfit=100; TakeProfit2=40; Stoploss=100; Lots=1; TrailingStop=30; per=18; per2=8; chas=2; totalt=1000; mm=0; risk=10; | ||||
| Bars in test | 1515 | Ticks modelled | 13947 | Modelling quality | n/a |
| Mismatched charts errors | 2 | ||||
| Initial deposit | 10000.00 | ||||
| Total net profit | -346.79 | Gross profit | 1278.49 | Gross loss | -1625.28 |
| Profit factor | 0.79 | Expected payoff | -8.89 | ||
| Absolute drawdown | 450.07 | Maximal drawdown | 786.92 (7.61%) | Relative drawdown | 7.61% (786.92) |
| Total trades | 39 | Short positions (won %) | 21 (66.67%) | Long positions (won %) | 18 (61.11%) |
| Profit trades (% of total) | 25 (64.10%) | Loss trades (% of total) | 14 (35.90%) | ||
| Largest | profit trade | 98.30 | loss trade | -120.03 | |
| Average | profit trade | 51.14 | loss trade | -116.09 | |
| Maximum | consecutive wins (profit in money) | 6 (351.63) | consecutive losses (loss in money) | 6 (-687.64) | |
| Maximal | consecutive profit (count of wins) | 351.63 (6) | consecutive loss (count of losses) | -687.64 (6) | |
| Average | consecutive wins | 4 | consecutive losses | 2 | |
| # | Time | Type | Order | Size | Price | S / L | T / P | Profit | Balance |
| 1 | 2009.12.01 21:00 | buy | 1 | 1.00 | 0.99893 | 0.99773 | 0.99993 | ||
| 2 | 2009.12.01 21:02 | buy | 2 | 1.00 | 0.99884 | 0.99764 | 0.99984 | ||
| 3 | 2009.12.01 21:20 | close | 1 | 1.00 | 0.99933 | 0.99773 | 0.99993 | 40.03 | 10040.03 |
| 4 | 2009.12.01 21:25 | close | 2 | 1.00 | 0.99926 | 0.99764 | 0.99984 | 42.03 | 10082.06 |
| 5 | 2009.12.02 21:00 | sell | 3 | 1.00 | 1.00237 | 1.00357 | 1.00137 | ||
| 6 | 2009.12.02 21:02 | sell | 4 | 1.00 | 1.00233 | 1.00353 | 1.00133 | ||
| 7 | 2009.12.02 21:50 | close | 3 | 1.00 | 1.00169 | 1.00357 | 1.00137 | 67.89 | 10149.95 |
| 8 | 2009.12.02 21:52 | close | 4 | 1.00 | 1.00185 | 1.00353 | 1.00133 | 47.91 | 10197.86 |
| 9 | 2009.12.03 21:00 | sell | 5 | 1.00 | 0.99856 | 0.99976 | 0.99756 | ||
| 10 | 2009.12.03 21:02 | sell | 6 | 1.00 | 0.99818 | 0.99938 | 0.99718 | ||
| 11 | 2009.12.03 21:45 | s/l | 5 | 1.00 | 0.99976 | 0.99976 | 0.99756 | -120.03 | 10077.83 |
| 12 | 2009.12.03 21:45 | s/l | 6 | 1.00 | 0.99938 | 0.99938 | 0.99718 | -120.03 | 9957.80 |
| 13 | 2009.12.04 21:00 | sell | 7 | 1.00 | 1.01859 | 1.01979 | 1.01759 | ||
| 14 | 2009.12.04 21:02 | sell | 8 | 1.00 | 1.01840 | 1.01960 | 1.01740 | ||
| 15 | 2009.12.04 21:10 | close | 7 | 1.00 | 1.01797 | 1.01979 | 1.01759 | 60.91 | 10018.71 |
| 16 | 2009.12.04 21:15 | t/p | 8 | 1.00 | 1.01740 | 1.01960 | 1.01740 | 98.30 | 10117.01 |
| 17 | 2009.12.07 21:00 | buy | 9 | 1.00 | 1.01953 | 1.01833 | 1.02053 | ||
| 18 | 2009.12.07 21:02 | buy | 10 | 1.00 | 1.01907 | 1.01787 | 1.02007 | ||
| 19 | 2009.12.07 21:15 | close | 10 | 1.00 | 1.01954 | 1.01787 | 1.02007 | 46.10 | 10163.11 |
| 20 | 2009.12.07 21:40 | close | 9 | 1.00 | 1.02001 | 1.01833 | 1.02053 | 47.06 | 10210.17 |
| 21 | 2009.12.08 21:00 | sell | 11 | 1.00 | 1.02830 | 1.02950 | 1.02730 | ||
| 22 | 2009.12.08 21:03 | sell | 12 | 1.00 | 1.02789 | 1.02909 | 1.02689 | ||
| 23 | 2009.12.08 21:10 | close | 11 | 1.00 | 1.02779 | 1.02950 | 1.02730 | 49.62 | 10259.79 |
| 24 | 2009.12.08 21:16 | close | 12 | 1.00 | 1.02738 | 1.02909 | 1.02689 | 49.64 | 10309.43 |
| 25 | 2009.12.09 21:00 | buy | 13 | 1.00 | 1.02701 | 1.02581 | 1.02801 | ||
| 26 | 2009.12.09 21:02 | buy | 14 | 1.00 | 1.02694 | 1.02574 | 1.02794 | ||
| 27 | 2009.12.09 21:20 | s/l | 13 | 1.00 | 1.02581 | 1.02581 | 1.02801 | -117.02 | 10192.41 |
| 28 | 2009.12.09 21:20 | s/l | 14 | 1.00 | 1.02574 | 1.02574 | 1.02794 | -117.02 | 10075.39 |
| 29 | 2009.12.10 21:00 | sell | 15 | 1.00 | 1.02656 | 1.02776 | 1.02556 | ||
| 30 | 2009.12.10 21:02 | sell | 16 | 1.00 | 1.02653 | 1.02773 | 1.02553 | ||
| 31 | 2009.12.10 21:20 | close | 15 | 1.00 | 1.02598 | 1.02776 | 1.02556 | 56.53 | 10131.92 |
| 32 | 2009.12.10 21:25 | close | 16 | 1.00 | 1.02606 | 1.02773 | 1.02553 | 45.81 | 10177.73 |
| 33 | 2009.12.11 21:00 | sell | 17 | 1.00 | 1.03419 | 1.03539 | 1.03319 | ||
| 34 | 2009.12.11 21:02 | sell | 18 | 1.00 | 1.03445 | 1.03565 | 1.03345 | ||
| 35 | 2009.12.14 00:00 | s/l | 17 | 1.00 | 1.03539 | 1.03539 | 1.03319 | -116.57 | 10061.16 |
| 36 | 2009.12.14 01:15 | close | 18 | 1.00 | 1.03386 | 1.03565 | 1.03345 | 56.38 | 10117.53 |
| 37 | 2009.12.14 21:00 | buy | 19 | 1.00 | 1.03206 | 1.03086 | 1.03306 | ||
| 38 | 2009.12.14 21:02 | buy | 20 | 1.00 | 1.03169 | 1.03049 | 1.03269 | ||
| 39 | 2009.12.14 21:20 | close | 20 | 1.00 | 1.03229 | 1.03049 | 1.03269 | 58.12 | 10175.65 |
| 40 | 2009.12.15 02:50 | close | 19 | 1.00 | 1.03247 | 1.03086 | 1.03306 | 40.20 | 10215.86 |
| 41 | 2009.12.15 21:00 | buy | 21 | 1.00 | 1.04097 | 1.03977 | 1.04197 | ||
| 42 | 2009.12.15 21:02 | buy | 22 | 1.00 | 1.04094 | 1.03974 | 1.04194 | ||
| 43 | 2009.12.16 02:20 | close | 21 | 1.00 | 1.04158 | 1.03977 | 1.04197 | 59.06 | 10274.91 |
| 44 | 2009.12.16 02:25 | close | 22 | 1.00 | 1.04145 | 1.03974 | 1.04194 | 49.46 | 10324.38 |
| 45 | 2009.12.16 21:00 | buy | 23 | 1.00 | 1.03985 | 1.03865 | 1.04085 | ||
| 46 | 2009.12.16 21:02 | buy | 24 | 1.00 | 1.04003 | 1.03883 | 1.04103 | ||
| 47 | 2009.12.16 21:20 | s/l | 23 | 1.00 | 1.03865 | 1.03865 | 1.04085 | -115.57 | 10208.81 |
| 48 | 2009.12.16 21:20 | s/l | 24 | 1.00 | 1.03883 | 1.03883 | 1.04103 | -115.58 | 10093.23 |
| 49 | 2009.12.17 21:00 | buy | 25 | 1.00 | 1.04660 | 1.04540 | 1.04760 | ||
| 50 | 2009.12.17 21:03 | buy | 26 | 1.00 | 1.04624 | 1.04504 | 1.04724 | ||
| 51 | 2009.12.17 21:20 | close | 26 | 1.00 | 1.04668 | 1.04504 | 1.04724 | 42.04 | 10135.27 |
| 52 | 2009.12.17 21:59 | close | 25 | 1.00 | 1.04702 | 1.04540 | 1.04760 | 40.11 | 10175.38 |
| 53 | 2009.12.18 21:00 | sell | 27 | 1.00 | 1.04285 | 1.04405 | 1.04185 | ||
| 54 | 2009.12.18 21:03 | sell | 28 | 1.00 | 1.04248 | 1.04368 | 1.04148 | ||
| 55 | 2009.12.18 21:10 | close | 27 | 1.00 | 1.04239 | 1.04405 | 1.04185 | 44.13 | 10219.51 |
| 56 | 2009.12.18 21:16 | close | 28 | 1.00 | 1.04202 | 1.04368 | 1.04148 | 44.15 | 10263.66 |
| 57 | 2009.12.21 21:00 | sell | 29 | 1.00 | 1.04556 | 1.04676 | 1.04456 | ||
| 58 | 2009.12.21 21:02 | sell | 30 | 1.00 | 1.04553 | 1.04673 | 1.04453 | ||
| 59 | 2009.12.21 21:15 | s/l | 29 | 1.00 | 1.04676 | 1.04676 | 1.04456 | -114.63 | 10149.03 |
| 60 | 2009.12.21 21:15 | s/l | 30 | 1.00 | 1.04673 | 1.04673 | 1.04453 | -114.63 | 10034.40 |
| 61 | 2009.12.22 21:00 | sell | 31 | 1.00 | 1.04804 | 1.04924 | 1.04704 | ||
| 62 | 2009.12.22 21:02 | sell | 32 | 1.00 | 1.04783 | 1.04903 | 1.04683 | ||
| 63 | 2009.12.22 22:07 | s/l | 32 | 1.00 | 1.04903 | 1.04903 | 1.04683 | -114.39 | 9920.01 |
| 64 | 2009.12.22 23:15 | s/l | 31 | 1.00 | 1.04924 | 1.04924 | 1.04704 | -114.35 | 9805.66 |
| 65 | 2009.12.23 21:00 | buy | 33 | 1.00 | 1.03950 | 1.03830 | 1.04050 | ||
| 66 | 2009.12.23 21:02 | buy | 34 | 1.00 | 1.03985 | 1.03865 | 1.04085 | ||
| 67 | 2009.12.23 22:50 | s/l | 34 | 1.00 | 1.03865 | 1.03865 | 1.04085 | -115.56 | 9690.10 |
| 68 | 2009.12.24 03:10 | s/l | 33 | 1.00 | 1.03830 | 1.03830 | 1.04050 | -114.08 | 9576.01 |
| 69 | 2009.12.28 21:00 | sell | 35 | 1.00 | 1.03496 | 1.03616 | 1.03396 | ||
| 70 | 2009.12.28 21:20 | close | 35 | 1.00 | 1.03449 | 1.03616 | 1.03396 | 45.43 | 9621.44 |
| 71 | 2009.12.29 21:00 | sell | 36 | 1.00 | 1.03670 | 1.03790 | 1.03570 | ||
| 72 | 2009.12.29 21:02 | sell | 37 | 1.00 | 1.03675 | 1.03795 | 1.03575 | ||
| 73 | 2009.12.29 21:20 | close | 36 | 1.00 | 1.03616 | 1.03790 | 1.03570 | 52.12 | 9673.56 |
| 74 | 2009.12.29 21:22 | close | 37 | 1.00 | 1.03632 | 1.03795 | 1.03575 | 41.49 | 9715.05 |
| 75 | 2009.12.30 21:00 | buy | 38 | 1.00 | 1.03706 | 1.03586 | 1.03806 | ||
| 76 | 2009.12.30 21:03 | buy | 39 | 1.00 | 1.03741 | 1.03621 | 1.03841 | ||
| 77 | 2009.12.30 21:16 | close | 38 | 1.00 | 1.03762 | 1.03586 | 1.03806 | 53.97 | 9769.02 |
| 78 | 2009.12.30 22:32 | s/l | 39 | 1.00 | 1.03621 | 1.03621 | 1.03841 | -115.81 | 9653.21 |